
Your reports dashboard
Requirements
- Available on: Starter and above
- Device access: Web & mobile browser
- Permission: Owner or Manager
Your reports dashboard gives you the headline numbers for your salon — revenue, appointments, tips — plus your top services, stylists, and clients, for whatever period you choose.
How to read your dashboard
-
In the left menu, open Reports.
<!-- CAPTURE: route=/reports | login=owner | state=data present (demo) | highlight=summary KPI cards | viewport=1440x900 -->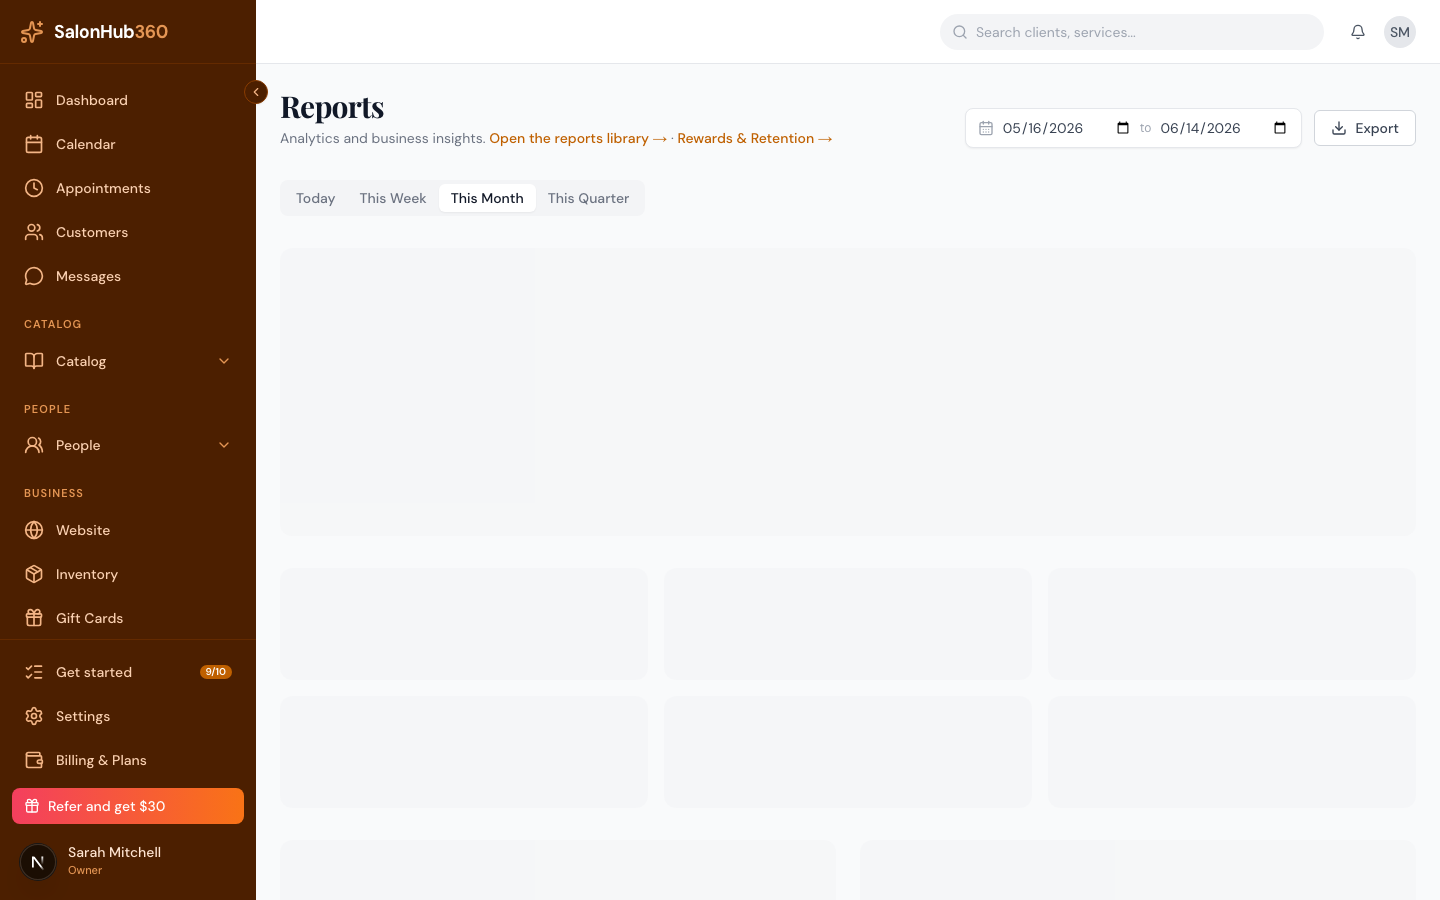
-
The cards at the top show your key totals for the period: Total Revenue, Net Revenue, Transactions, Tips, Total Appointments, and Refunds.
-
Use the date filter to change the period. Pick a preset — Today, This Week, This Month, or This Quarter — or enter a custom start and end date.
<!-- CAPTURE: route=/reports | login=owner | state=date presets visible | highlight=date-range filter | viewport=1440x900 -->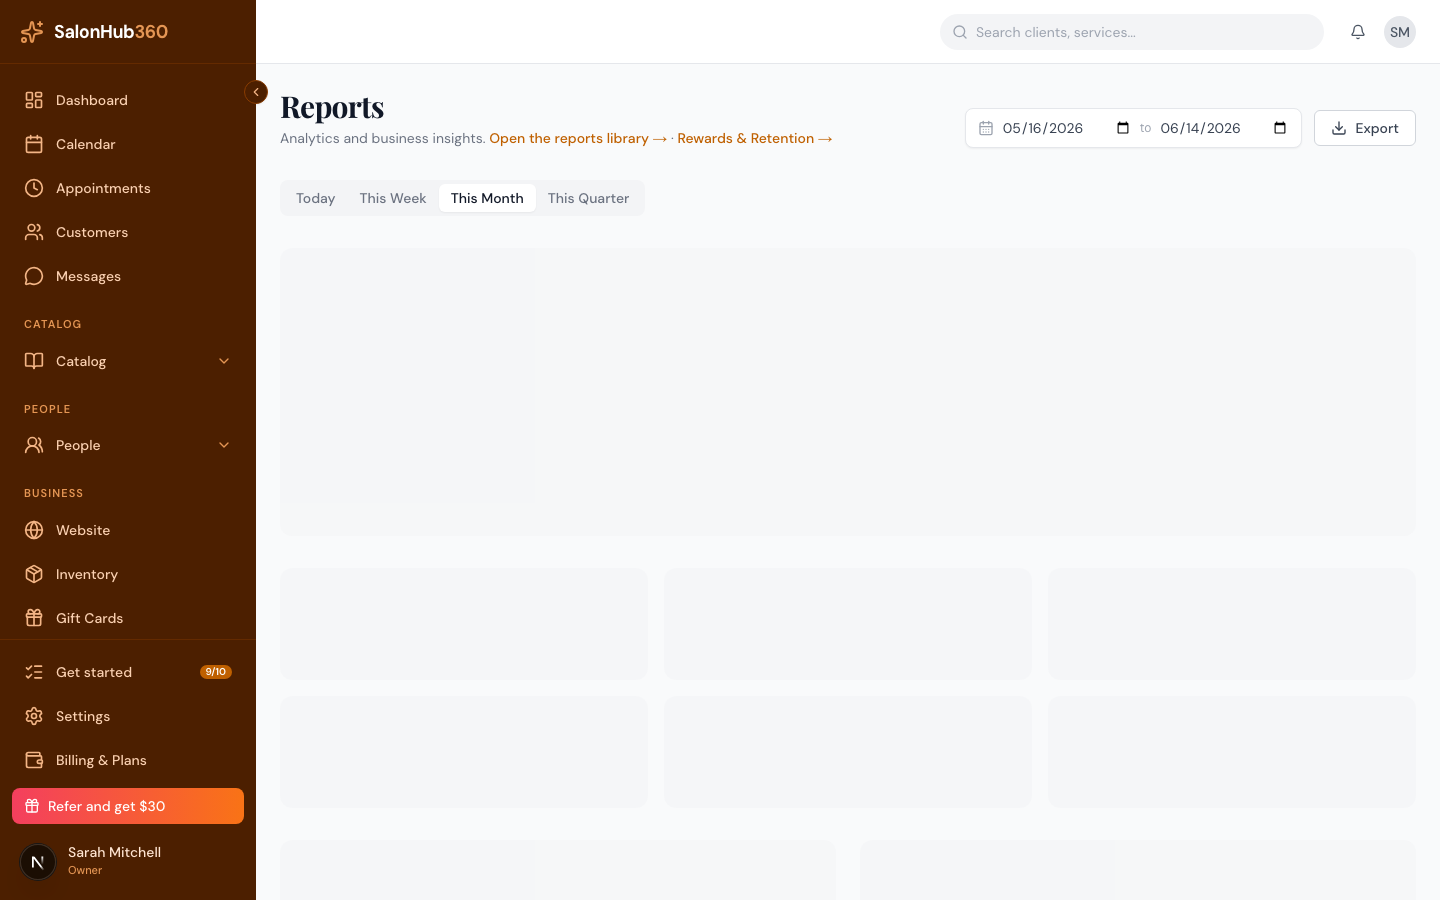
-
Below the totals you'll find:
- Revenue Overview — daily revenue for the period.
- Top Services — your best sellers, ranked by revenue, with booking counts.
- Top Stylists — staff ranked by revenue, with appointment counts.
- Top Customers — clients ranked by spend, with visit counts.
- Appointments by Status — how appointments split across completed, no-show, and other statuses.
Note: If there's no activity in the period yet, you'll see "No activity in this period yet. Once you take bookings and payments, your analytics will appear here." Total Revenue includes gift card sales — your Rewards & Retention report shows outstanding gift card balances separately.
Tip: Need a detailed, downloadable breakdown rather than the dashboard view? See Run a report from the library.
Related articles