
Run a report from the library
Requirements
- Available on: Starter and above
- Device access: Web & mobile browser
- Permission: Owner or Manager
The report library lets you pull a focused, downloadable report for a date range — handy for utilisation reviews, customer trends, and front-desk operations. Results download as a file you can open in a spreadsheet.
How to run a report
-
In the left menu, open Reports, then go to the library (at /reports/library).
<!-- CAPTURE: route=/reports/library | login=owner | state=library list (demo) | highlight=report list | viewport=1440x900 -->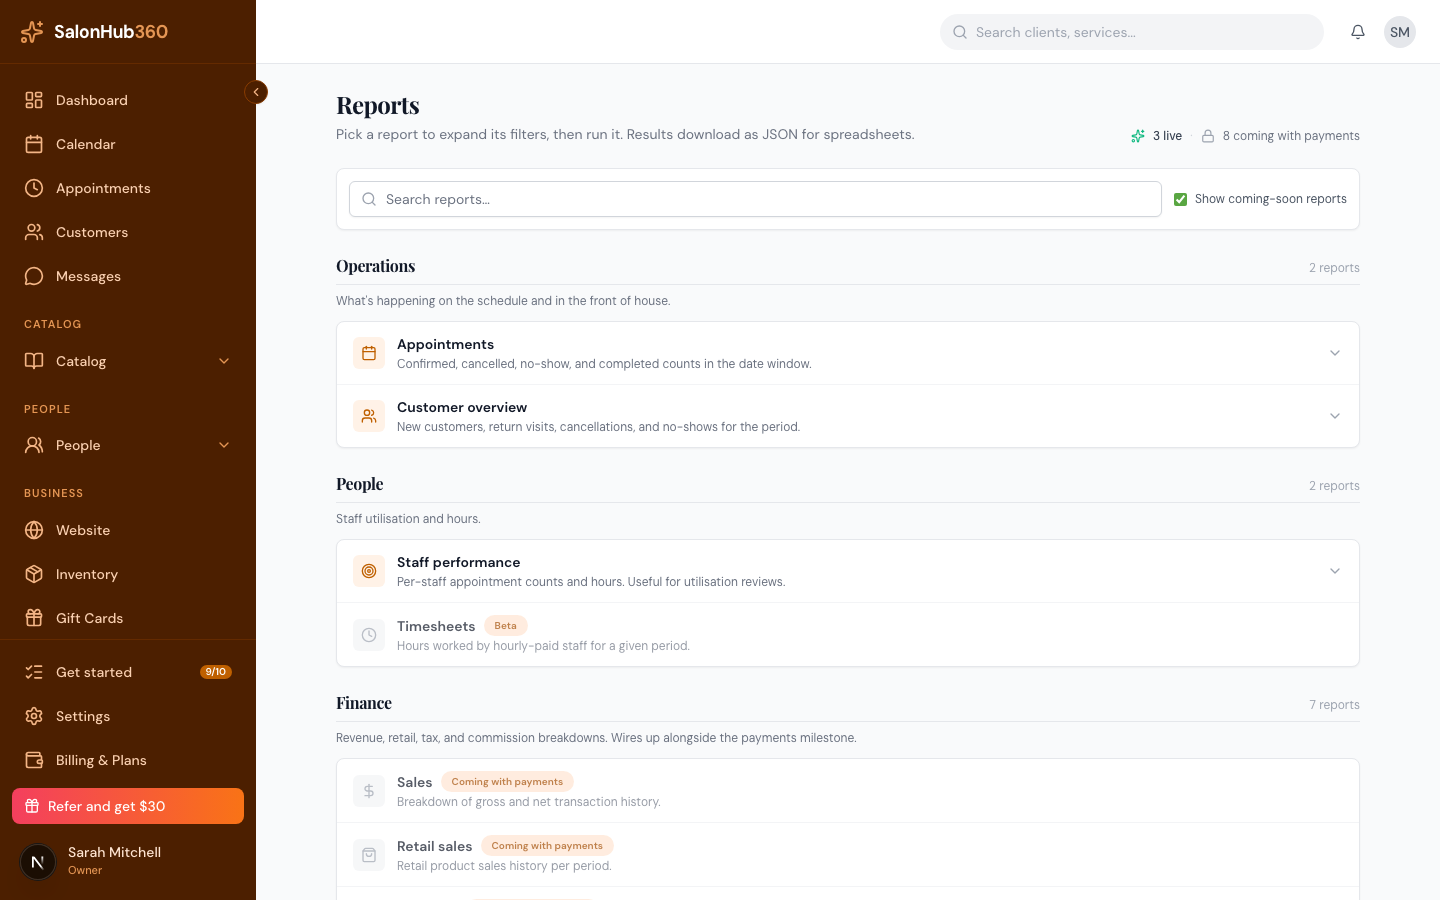
-
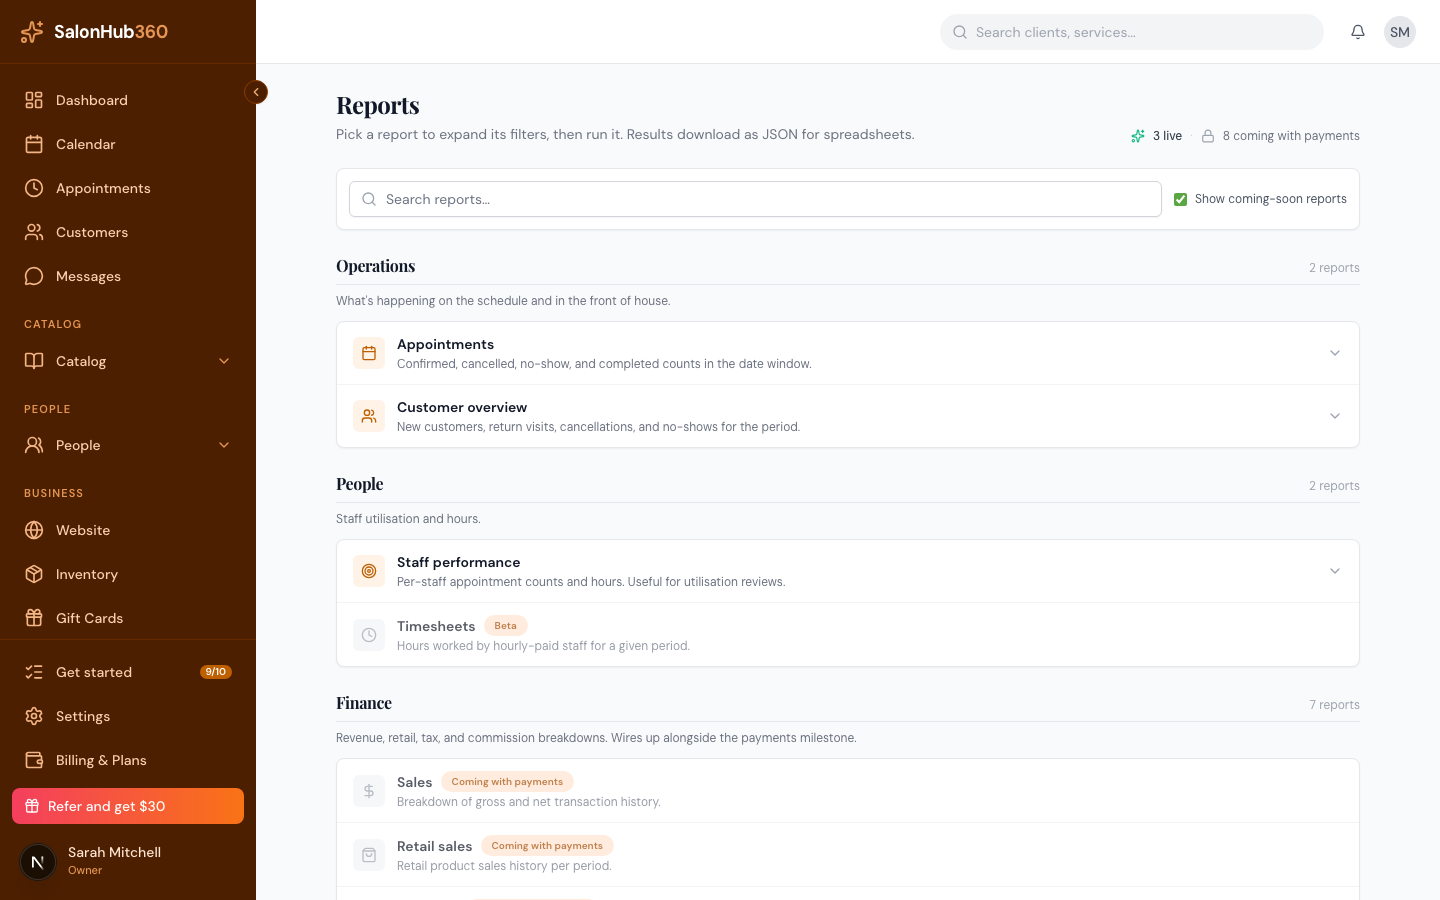
Pick a live report and click it to expand its filters. The reports that run today are:
- Appointments — confirmed, cancelled, no-show, and completed counts in the date window.
- Customer overview — new customers, return visits, cancellations, and no-shows for the period.
- Staff performance — per-staff appointment counts and hours.
-
Set the Date range (use the quick presets like Last 7 days / Last 30 days / Last 90 days), and choose a staff member where a staff filter is offered.
-
Click Run report. When it finishes, click Download JSON to save the results for your spreadsheet.
<!-- CAPTURE: route=/reports/library | login=owner | state=report generated | highlight=Download JSON button | viewport=1440x900 -->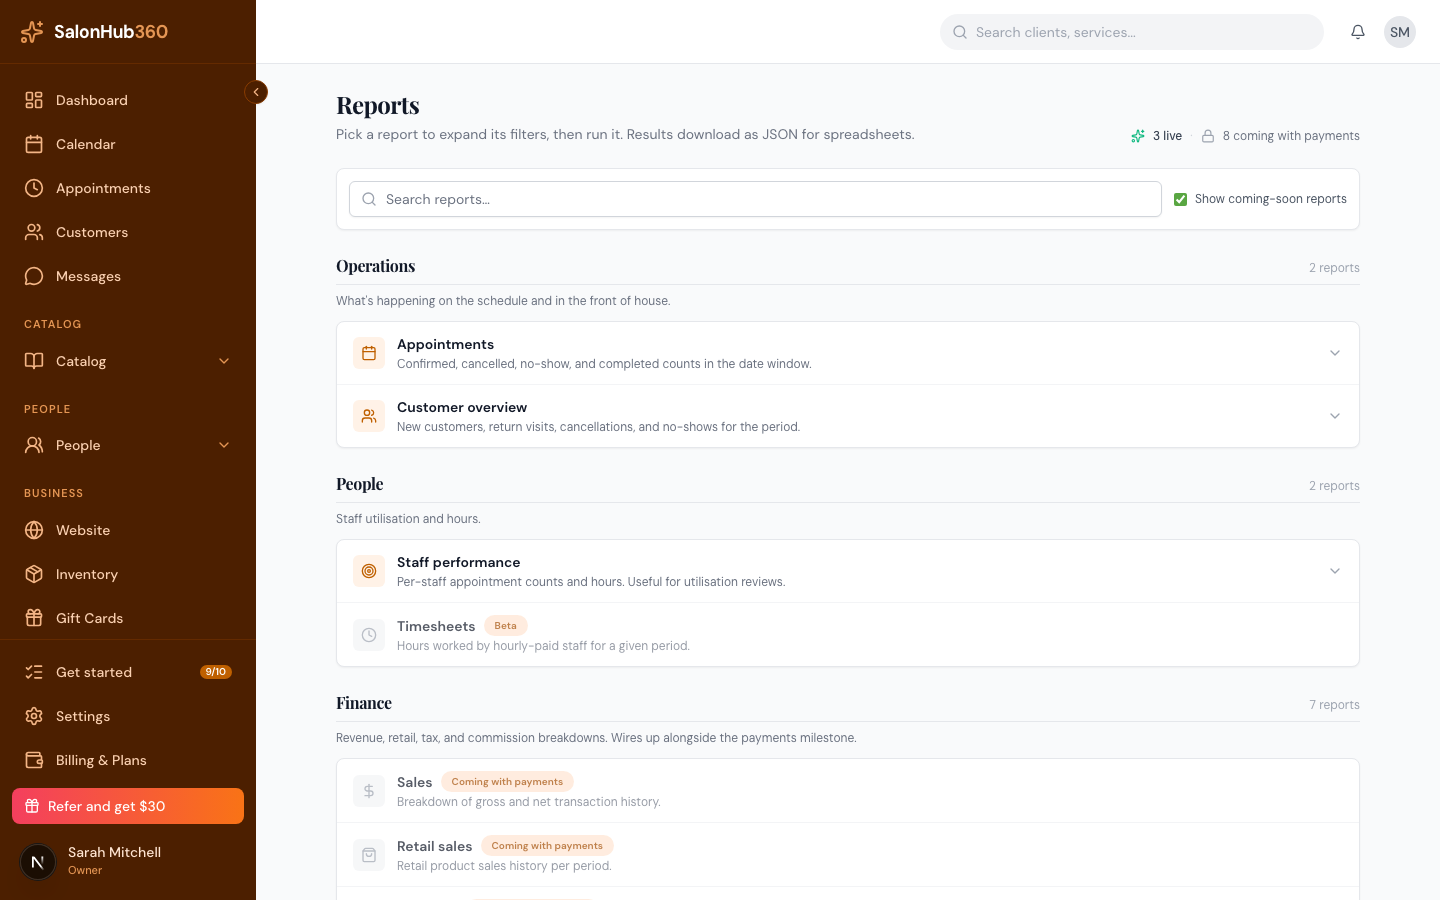
Note: Revenue and finance reports — sales, retail, sales tax, transaction detail, commissions, and more — are marked "Coming with payments" and will switch on alongside the payments milestone. The summary at the top of the library shows how many are live versus coming (for example, "3 live · 7 coming with payments"). The Timesheets report is marked Beta.
Tip: For at-a-glance totals and top performers without running a report, use your reports dashboard.
Related articles